Introduction
In the last blog post (Fujitsu Waterstage home automation/domotica) I talked about monitoring my Fujitsu Waterstage using the BSB-LAN appliance. This post will explain the specifics on how I set this up within my environment. Although I will be sharing all my files and configs from multiple applications as examples, I’m 100% sure that there are better ways to set up the Node-Red flow more efficient, as I just did this quick and dirty.
Somewhere during 2021 InfluxData released their new Flux system based on InfluxDB 2.0. Since this is a big change essentially forcing me to rewrite all my Grafana dashboards and scripts to update to the latest version, I haven’t done that yet. If you are starting with a blank page, my advice would be to use InfluxDB 2.0 and rewrite my examples from InfluxQL to Flux. Even though this guide will lose its copy paste value, this will save you a LOT of time in the future redoing everything like I will have to.
Guide
Goals
This post will explain the following:
- Configure MQTT in BSB-LAN.
- Verify the data is received on the MQTT server.
- Create a new InfluxDB database and user.
- Leverage Node-Red to read the MQTT messages and write them to InfluxDB.
- Use Grafana to connect to the database and create a dashboard.
Requirements
Before we continue, lets set up a list of requirements.
This guide expects the following services to be present and running on your network. I will not explain setting up every single service in this guide. There are hundreds of setup guides and documentation is readily available for these well-known services, please make sure they are running before continuing.
- MQTT server
- An MQTT server is required to receive and distribute messages sent by BSB-LAN. I am using Mosquitto ⧉ running in a container.
- InfluxDB
- InfluxDB is a time series database which will store the sensor data coming from BSB-LAN, which can be consumed by Grafana. This post is based on InfluxDB 1.7 running in my environment, any version using InfluxQL should work without modifications.
- Node-Red
- Node-Red is a visual flow-based programming tool which I will be using to read BSB-LAN data from the MQTT server, modify the datastructure and inject the data into the InfluxDB. My Node-Red ⧉ is running in a container.
- Grafana
- The actual dashboarding program to visualize the sensor data coming from the heatpump/BSB-LAN. It connects to the database for sensor data. Just like the others, my Grafana ⧉ runs in a container.
Configure BSB-LAN to MQTT Logging
- Step 1
- One of the first things that’s required for MQTT to even work on the BSB-LAN device is a change in the configuration. In the original guide I mentioned this as an optional step to prepare MQTT. If you have already done that optional step, feel free to skip to Step 3.
First, open up the BSB-LAN Arduino project and find the BSB-LAN configuration fileBSB_LAN/BSB_LAN_config.h. Within this file there is a section dedicated to MQTT. The values to edit will be:mqtt_mode- To tell BSB-LAN to use MQTT and also which format to use, I use the plain text format for my setup.mqtt_broker_ip_addr[4]- Configure the IP address of the MQTT server on the network.MQTTUsername[32]- Set a username if authentication is required, leave blank for no authentication.MQTTPassword[32]- Set a password if authentication is required, leave blank for no authentication.MQTTTopicPrefix[32]- Set the topic of the messages, this basically sorts all values in a folder like structure instead of just dumping them all in the MQTT server root.MQTTDeviceID[32]- Gives the BSB-LAN client a name, change this if you have multiple BSB-LAN devices.
What the config file looks like for me:
1
2
3
4
5
6
7
8
9
10
11
12
#define MQTT
byte mqtt_mode = 1; // MQTT: 0 - disabled, 1 - send messages in plain text format, 2 - send messages in JSON format, 3 - send messages in rich JSON format. Use this if you want a json package of your logging information printed to the mqtt topic
// JSON payload will be of the structure: {"MQTTDeviceID": {"status":{"log_param1":"value1"}}}
// rich JSON payload will be of the structure: {"MQTTDeviceID": {"id": "parmeter number from log values", "name": "parameter name from logvalues", "value": "query result", "desc": "enum value description", "unit": "unit of measurement", "error", error code}}
byte mqtt_broker_ip_addr[4] = {192,168,55,54}; // MQTT broker ip address. Please use commas instead of dots!!!
char MQTTUsername[32] = "";                 // Set username for MQTT broker here or set empty string if no username/password is used.
char MQTTPassword[32] = "";                 // Set password for MQTT broker here or set empty string if no password is used.
char MQTTTopicPrefix[32] = "BSB-LAN"; 	        // Optional: Choose the "topic" for MQTT messages here. In case of empty string, default topic name will be used

// Optional: Define a device name to use as header in json payload. In case of empty string, "BSB-LAN" will be used.
// This value is also used as a client ID towards the MQTT broker, change it if you have more than one BSB-LAN on your broker.
char MQTTDeviceID[32] = "BSB-LAN";
- Step 2
- Because of the changes in the Arduino project config file, the project must be rebuilt and uploaded to the microcontroller. There are two ways of doing this:
- Locally connected.
Just like the original guide, connect the microcontroller to your computer through USB and flash it through the serial connection. Disconnecting it from the heatpump is not necessary. Make sure your IDE still has the correct COM port selected (these change sometimes!). From Arduino IDE selectSketch->Uploadand things should be underway. Immediately after open the Serial monitor underTools->Serial Monitorto see the feedback from the microcontroller during startup. Make sure it’s online and we’re done. - Over the air (ESP32 Only!).
BSB-LAN has the posibility to do an OTA flash. Please make sure the BSB-LAN settingGeneral - OTA Updatein the webbrowser is defined asOnbefore doing this. From Arduino IDE selectSketch->Export compiled Binaryto build and save the .bin file on your computer (mine is calledBSB_LAN.ino.esp32-evb.bin). Now go to<your-BSB-LAN-IP>:8080in the browser, clickChoose Fileand select the .bin file you just exported, followed by clickingUpdate. If everything goes well, your BSB-LAN should be back online after a few minutes. If for any reason it bricks, there is no other option than locally flashing it again.
- Locally connected.
- Step 3
- Before we configure BSB-LAN to actually start sending logs to MQTT (if you followed my install guide, logging will be set to
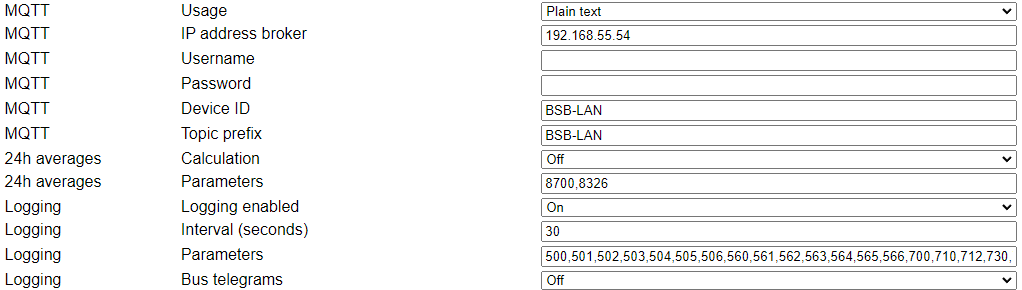
false), it’s time to figure out which parameters we actually want to log. The way I did this was to bring up the technical manual of my heatpump and find all the parameters I want to see. I ended up with the following parameters and entered them into the BSB-LAN web config underLogging - Parameters.
Parameters:1
500,501,502,503,504,505,506,560,561,562,563,564,565,566,700,710,712,730,740,741,1602,1610,1612,1640,1642,1644,1645,8700,8701,8702,8703,8830,8831,8744,8412,8410,8395,8396,8397,8398,8450,8451,8000,8003,8006,8336
![Parameter config]() And for reference, what these parameters do for my Fujitsu Waterstage:
And for reference, what these parameters do for my Fujitsu Waterstage:
 And for reference, what these parameters do for my Fujitsu Waterstage:
| Parameter | Description | Parameter | Description | |
|---|---|---|---|---|
| 500 | Time Program HC1 Mo | 1610 | DHW temp nominal setpoint | |
| 501 | Time Program HC1 Tu | 1612 | DHW temp reduced setpoint | |
| 502 | Time Program HC1 We | 1640 | Legionella function | |
| 503 | Time Program HC1 Th | 1642 | Legionella function day | |
| 504 | Time Program HC1 Fr | 1644 | Legionella function time | |
| 505 | Time Program HC1 Sa | 1645 | Legionella function setpoint | |
| 506 | Time Program HC1 Su | 8700 | Outside temp sensor | |
| 560 | Time Program 4 DHW Mo | 8701 | Lowest historic outside temp | |
| 561 | Time Program 4 DHW Tu | 8702 | Highest historic outside temp | |
| 562 | Time Program 4 DHW We | 8703 | Outside temp attenuated (24h avg) | |
| 563 | Time Program 4 DHW Th | 8830 | DHW temp actual value top | |
| 564 | Time Program 4 DHW Fr | 8831 | DHW temp current setpoint | |
| 565 | Time Program 4 DHW Sa | 8744 | Flow temperature setpoint | |
| 566 | Time Program 4 DHW Su | 8412 | Flow temperature supply | |
| 700 | Operating Mode | 8410 | Flow temperature return | |
| 710 | Room temp Comfort setpoint | 8450 | Operating hours compressor | |
| 712 | Room temp Reduced setpoint | 8451 | Compressor start count | |
| 730 | Summer/winter changeover temp | 8000 | Status heating circuit 1 | |
| 740 | HC1 Flow temp min limitation | 8003 | Status - Status DHW | |
| 741 | HC1 Flow temp max limitation | 8006 | Status - Status Heat Pump | |
| 8336 | Heat Pump total operating hours |
- Step 4
- With the parameters all configured we have to think about the interval at which BSB-LAN will send sensor data to MQTT. At first I thought, well, lets do this every 5 seconds! Unfortunately, that’s not going to work. As mentioned in the previous guide, the BSB protocol is very low bitrate. Depending on your heatpump it may take up to a full second to retrieve a parameter value from the heatpump. My current setup, with the parameters above, takes about 25 seconds to complete. With my initial idea of a 5 second interval, BSB-LAN would crash as it started a new interval before the last task was finished.
So with 40+ parameters to log taking around 25 seconds, I settled with an interval of 30 seconds, giving around 5 seconds to spare before starting the new interval.
Keep in mind that BSB-LAN is a single process project. When BSB-LAN is busy polling and logging the parameters the webinterface and all other functions will be queued. In case of my setup, BSB-LAN will be unresponsive for 25 seconds and then function for 5 seconds before entering the 25 seconds unresponsiveness again in a loop. Play with the interval or the number of parameters to adjust this to your liking.
- Step 5
- Verify the configuration in the webbrowser and switch the
Logging - Logging enabledoption toOn. It should look something like the screenshot below. If all is well, press theSave parameterbutton on the bottom of the configuration page to enable it all.![Webconfig Overview]()
- Step 6
- The last step is to verify the sensor data actually reaching the MQTT server. I use an awesome free small program called MQTT Explorer ⧉. To give you an idea what it should look like:

Set up InfluxDB
When it comes to storing data, I like to keep my different types of sensor data in seperate databases. This is nothing more than preference and as far as I know has nothing to do with best practices. What I’ve done is create a new database on my InfluxDB system with a dedicated user and password. Also, my InfluxDB is still running in a VM, so I have easy access to the CLI to do database maintenance. You can also use external management tools or API calls with cURL, if you want to do that, the answer is a Google query away. I will explain the CLI option here.
There aren’t a lot of things to do, so lets get into it:
- Log on to the InfluxDB system to get to the CLI.
In the following step I’m authenticating with plain-text passwords in the shell. Please keep in mind that this is a possible security breach as the system shell command history will show your plain-text password for anyone on the system. In any production environment, please log on with encrypted passwords or use the “auth” command inside the InfluxQL CLI to avoid this.
- Type
influx -username admin -password <password>, this should be the admin account you set up during installation, if you set it up without user, no authentication is required throughout the following steps, but I recommend setting it up.1 2 3 4 5
matts@influxdb:~$ influx -username admin -password <password> Connected to http://localhost:8086 version 1.7.6 InfluxDB shell version: 1.7.6 Enter an InfluxQL query >
- Create a new database with
CREATE DATABASE <databasename>, I will use ‘heatpump’ as DB name.1 2
> CREATE DATABASE heatpump >
- Verify it has been added with
SHOW DATABASES.1 2 3 4 5 6
> SHOW DATABASES name: databases name ---- _internal heatpump
- Create a database user with
CREATE USER <username> WITH PASSWORD '<password>'. I create a user called heatpump_dbsa (heatpump as the database name and _dbsa short for database service account, just a little naming convention)1 2
> CREATE USER heatpump_dbsa WITH PASSWORD '123456' >
- Verify user has been added with
SHOW USERS.1 2 3 4 5
> SHOW USERS user admin ---- ----- admin true heatpump_dbsa false
- Finally, assign rights for the created user to allow database access using
GRANT ALL ON "<databasename>" TO "<username>".1 2
> GRANT ALL ON "heatpump" TO "heatpump_dbsa" >
- Verify with
SHOW GRANTS FOR "<username>"1 2 3 4 5
> SHOW GRANTS FOR "heatpump_dbsa" database privilege -------- --------- heatpump ALL PRIVILEGES >
Set up Node-Red flows
I use Node-Red for any automation and logic that’s required to make things work together. In this case a Node-Red workflow will be used to transform the messages from MQTT to something that can be saved to the InfluxDB database. What I’ve set up is a very simple flow to do exactly what I need with static values and duplicated this for each parameter. This is very basic and not as efficient as it can be. Ideally, it would be a single flow that would dynamically load the parameters and write the correct values to the database. My programming/scripting skills are not that great and the solution is quite ugly in my opnion, but it does the job. If you have any tips or examples, feel free to show me!
Node-Red flows consist of nodes, this flow requires one additional node that needs to be installed, it’s in the InfluxDB nodes package. To install this package, press the hamburger menu (top right) and go to Manage palette. A menu opens with two tabs named Nodes and Install, go to Install. In the searchbar type influx, find node-red-contrib-influxdb in the list and click the install button (As I have already installed it, it says installed). 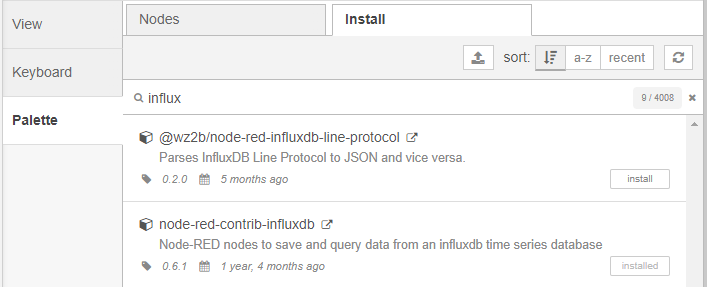
To give you a headstart I’ve created an importable copy of my own flows, since the JSON file is quite large please grab it from the MattsTechInfo/kickstart repository ⧉.
Once again in Node-Red, press the hamburger menu (top right) and go to Import. Copy the JSON code from the file linked above and paste it into the text area, or, download the node-red-flows.json file and upload it. Also select Import to: new flow. You can now drop all the nodes onto the canvas by clicking when they are in a position you like.
Now there are two configuration nodes that have to be edited, the MQTT server/broker and the InfluxDB server.
- MQTT
- On the top-right there is an Info button which should be opened by default, if not, click it.
- In the flows and nodes tree below that, find the
MQTT Serverconfiguration node and double click it. (Global Configuration Nodes -> mqtt broker -> MQTT Server) The configuration panel will open. - Replace the
Server, which currently saysreplaceme, with the DNS or IP adress to your MQTT server. - Optional, rename the Client ID if you wish, I called it Node-Red.
- Security: If your MQTT server requires TLS, please set the checkmark. If your MQTT server requires authentication, please set the user and password on the Security tab.
- Press the
Updatebutton. - Your MQTT node is now configured.
- InfluxDB
- Just like the MQTT node, find the
[v1.x] InfluxDB - Heatpumpconfiguration node and double click it (Global Configuration Nodes -> influxdb -> [v1.x] InfluxDB - Heatpump) - Replace the
Host, which currently saysreplaceme, with the DNS or IP address to your InfluxDB server. - Replace the
Databaseif you gave it a different name before. - Set the username and password created during the setup InfluxDB section.
- If you’ve configured InfluxDB to use SSL/TLS, please enable it here.
- Press the
Updatebutton. - Your InfluxDB node is now configured.
- Just like the MQTT node, find the
The last step is to deploy the flows, this will mark the canvas as active within Node-Red and will start “working”. This can simply be done by pressing the big red Deploy on the top right next to the hamburger menu. Fun fact, this only turns red when you have active changes that differ from the currently deployed version. After every change you make in the future, be sure to press deploy or your changes will be gone.
If everything worked out you should see something like this (MQTT nodes should show green and connected, InfluxDB nodes show nothing unless it throws an error): 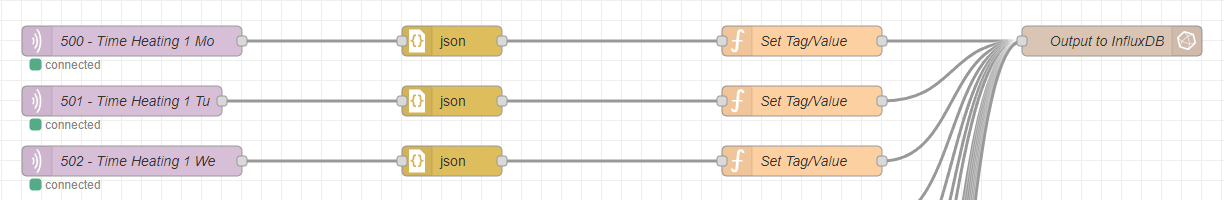
Building the Grafana Dashboard
Now that all the sensor data is in InfluxDB, it can be converted to a visual dashboard using Grafana for a nice overview and all kinds of posibilities to view telemetry. Building Grafana dashboards takes a lot of time, but I love both the looks and functionality of a well thought out dashboard. Even though my current Heatpump dashboard is just the first iteration, it will show most interesting data for my Fujitsu Waterstage. Just like the Node-Red flows, you can also copy my dashboard to get a kickstart!
Before importing the dashboard Grafana needs a data source configured so data can be accessed after the dashboard import.

- In the sidebar menu (on the left) press the Cog icon. The
Data Sourcespage will be opened. - Click on the button
Add data source. - Find and click
InfluxDBunder theTime series databasessection. - Give your data source a name, I called mine
Heatpump. - Select the
InfluxQLquery language. - Set the
URLto your InfluxDB DNS name or IP address, make sure to include the port (add:8086for the default). - Activate
Basic auth. - For the
Basic Auth Detailsfill in the database user and password configured earlier (for me, that’sheatpump_dbsa). - Under
InfluxDB Details, change theDatabasetoheatpumpor your own if you created a different one. - Don’t touch anything else and press
Save & Test.
If everything was filled out correctly, you should see the following pop up: 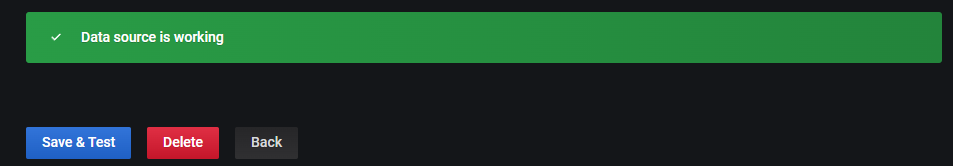
Now all that’s left to do is to import the dashboard JSON to Grafana. Again, the JSON file used for the import is quite large, please copy it from the MattsTechInfo/kickstart repository ⧉.
If you’ve changed the name of the Data Source in the previous step, it must be changed in the Grafana Dashboard Panels as well. Changing the dashboard panel’s datasources one by one is quite tedious, I suggest opening the JSON in your favorite file editor and replacing
"datasource": "Heatpump"with"datasource": "yourdatasourcename"before running the import.
In the sidebar menu, hover over the + sign and click on Import. Copy the JSON code from the file linked above and paste it into the text area, or, download the heatpump-grafana-dashboard.json file and upload it. Press the Load button, a new page shows up where you can change the dashboard name and the folder to store the dashboard, press the Import button when ready. Your dashboard is now ready and should show your heatpump’s information! 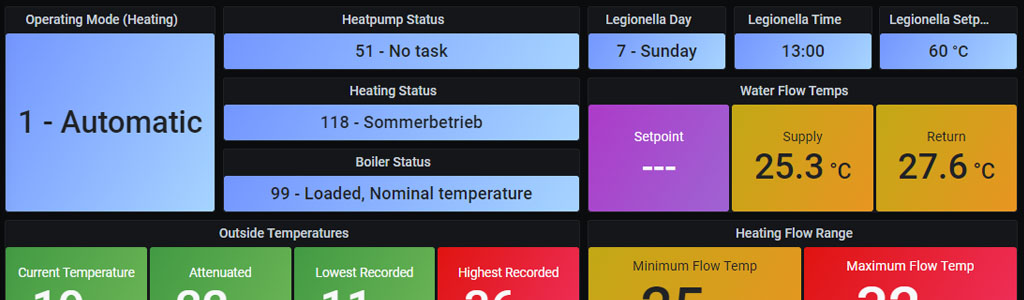
Conclusion
Congratulations, you’ve got yourself a nice dashboard to monitor your heatpump. No more looking at the physical display in the utility room.
That concludes this post and guide, please feel free to send me feedback or ask any additional questions. You can contact me through the comments section, GitHub discussions or join our Discord for realtime chat ⧉. If you find any errors please open up an issue using this link create an issue ⧉ and I will have a look! If you feel you are missing parts in the guide or if you ran into problems I’m also happy to add that information.